Key Takeaways
•The Short Answer: In the Matthews Boston Multifamily Market Report (June 2026), older Class C apartment buildings sit at 3.6% vacancy and newer Class A buildings sit at 8.0%.
•The Price Gap: Matthews puts Class C asking rent at $2,222 a month and Class A at $3,457, a gap of $1,235 a month (June 2026).
•The Supply Gap: Builders have 8,324 Class A units under construction and only 8 Class C units, per Matthews.
•The Bottom Line: In June 2026, Matthews shows Boston-area rent growth of 1.1%. These numbers describe occupancy and rents today. They do not forecast income or returns.
Is Boston's Rental Market Soft Everywhere, or Just at the Top?
Most people assume Boston's rental slowdown hits every building the same way. It does not.
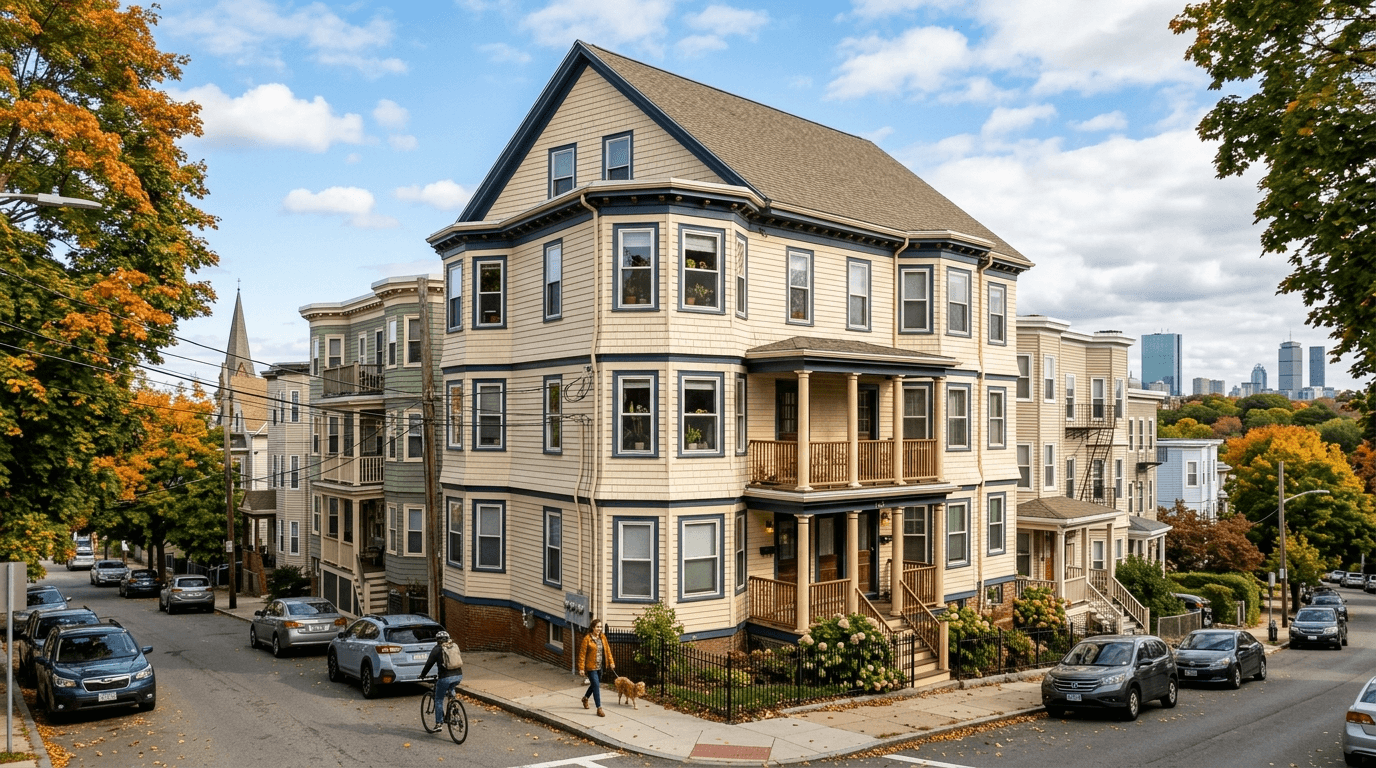
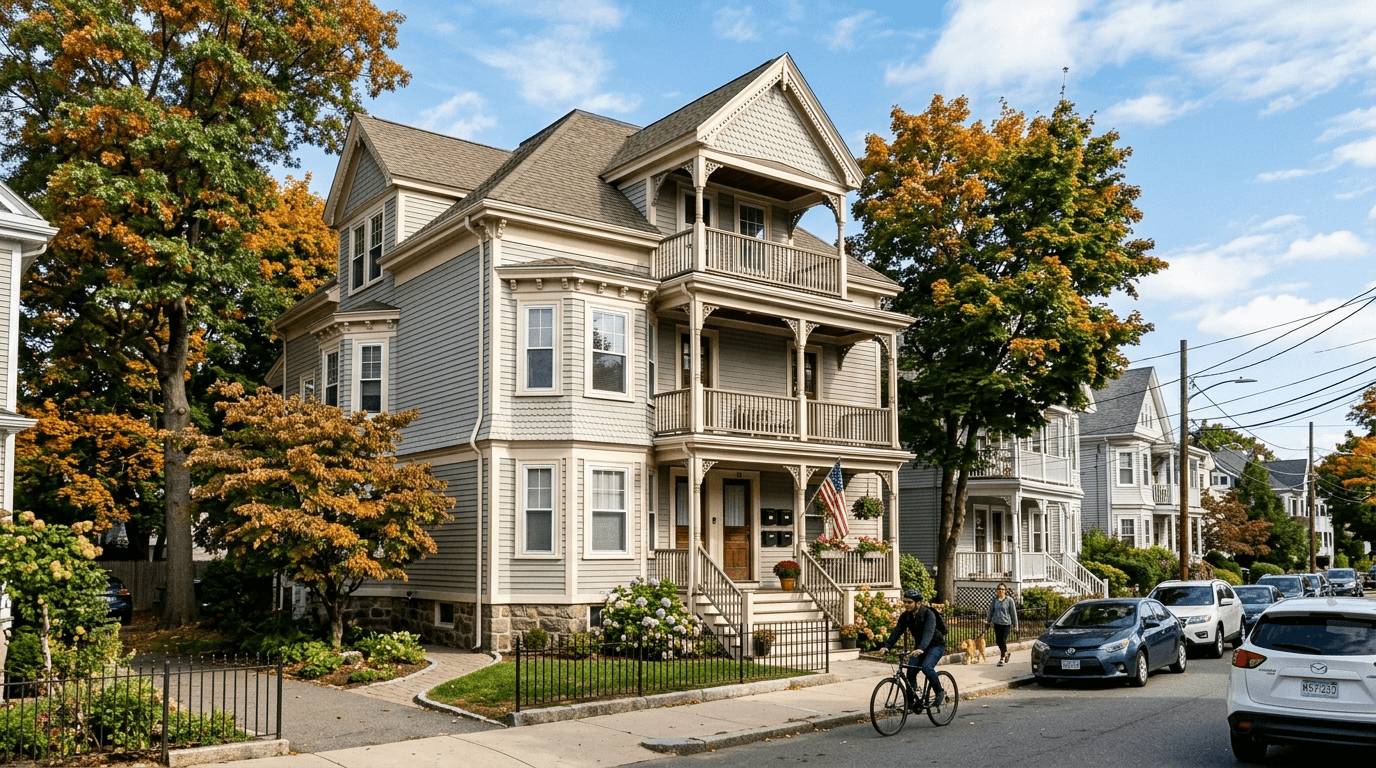
Landlords grade buildings by class. Class A means newer luxury buildings. Class B means mid-range, somewhat older buildings. Class C means older, more basic buildings with lower rents. These are common industry labels, and Matthews does not define its classes on this page. In this article, "towers" means newer Class A buildings. Matthews does not say every Class A building is a tower, and it does not say it counts three-deckers. Class C is the closest stand-in for older, basic buildings, not a measured three-decker rate. Matthews' "Boston" is a regional market that reaches beyond the city.
According to the Matthews Boston Multifamily Market Report (June 2026), overall vacancy in its Boston market is 6.1%, below the national 8.3%. That same report shows the largest vacancy rate in Class A, the newer buildings (8.0%). Matthews' later September 2026 report shows overall vacancy of 5.2% and rent growth of 2.0% for the Greater Boston metro, but its text page gives no split by class, so this article uses the June class table.
The comparison that matters is asking rent by building class, not the Boston-area average.
Why Is Class C Vacancy Lower Than Class A Vacancy?
Two numbers stand out in the Matthews data: asking rent and new supply.
Class A vacancy is more than twice the Class C rate. Matthews shows Class B vacancy at 5.7% (June 2026).
The price difference: Class C asking rent is $2,222 a month, while Class A is $3,457, a gap of $1,235 a month (Matthews, June 2026).
The second difference is supply. Matthews says Class A made up 77% of recent deliveries, and builders now have 8,324 Class A units under construction, 4,989 Class B, and just 8 Class C (June 2026).
Boston Multifamily Metrics by Building Class
Compares Boston multifamily vacancy, asking rent, construction pipeline, and year-to-date absorption across Class A, Class B, and Class C buildings in the Matthews June 2026 market report.
| Category | Class A | Class B | Class C |
|---|---|---|---|
| Vacancy | 8.0% | 5.7% | 3.6% |
| Asking rent | $3,457 | - | $2,222 |
| Units under construction | 8,324 | 4,989 | 8 |
| Absorption this year | - | - | −15 units |
Matthews shows only 8 Class C units under construction in its Boston market (June 2026), so little new supply is arriving in that class.
Could New Towers Pull Down Rents in Older Buildings?
Matthews shows Class A vacancy falling from 10.9% in March 2026 to 8.0% in June 2026. Matthews also reports only 177 construction starts in Q2 2026, the lowest since 2016. The report does not forecast what happens to the gap between classes.
Meanwhile, Matthews counts 13,321 units under construction across all classes (June 2026), down about 2,000 from a year earlier.
Matthews shows renters absorbed (newly rented) 1,419 Class A units and 330 Class B units year to date as of June 2026, while Class C absorption was −15 units. Matthews does not explain the Class C figure.
Overall rents are flat to slightly up. The Matthews Boston Multifamily Market Report (June 2026) puts Boston-area rent growth at 1.1%, and its Southwest Boston submarket at −1.5%. Both are all-class figures.
The Matthews figures show a $1,235 monthly asking-rent gap between Class A and Class C and 8 Class C units under construction (June 2026). The report does not forecast returns or rent gains.
How Do the Boston-Area Numbers Apply to Dorchester, Roxbury, Hyde Park, and East Boston?
Matthews' Boston-area numbers do not describe one block or one neighborhood. Its submarket table does not name Dorchester, Roxbury, Hyde Park or East Boston. A buyer can test:
•Are there new towers within walking distance?
•Is the unit near transit?
•Are nearby rents truly comparable?
•Are nearby leases renewing at similar rents?
Supply varies by submarket. Matthews shows its Chelsea/Revere/Charlestown submarket at 8.6% vacancy with 1,337 units under construction (June 2026). Matthews does not say which submarket holds each neighborhood named above. New supply nearby is one input a model can test.
Matthews' Greater Boston market (June 2026) shows private-capital buyers of 10-100 unit buildings at a 6.5% cap rate, year to date in 2026, against a 5.1% market average over the trailing twelve months. Cap rate is yearly income as a share of purchase price. Two- and three-families are smaller than that segment. A model built from a building's actual leases and rents can test how a smaller building compares.
Two recent rule changes:
•Rent control: On June 23, 2026, the Supreme Judicial Court ruled that the statewide rent-control question could not go on the November 2026 ballot because it included a religious-facilities exemption (WBUR, read Oct. 23, 2026). Supporters have hinted they could try again in 2028.
•Broker fees: Under the Massachusetts broker-fee law that took effect Aug. 1, 2025, the person who hires the broker pays the fee (Mass.gov, checked Oct. 23, 2026). NBC Boston reported in September 2026 that renters who believe they were charged a broker fee by a broker they did not hire can file a complaint with the Attorney General's Office.
What Do the Numbers Show for Older Buildings and New Towers?
In June 2026, Matthews shows 8 Class C units and 8,324 Class A units under construction. The numbers do not say which building suits a given buyer. That depends on price, rents and repairs a buyer can test in a model.
Before you buy, check four things against the actual leases: in-place rents vs. nearby asking rents, new buildings within walking distance, the broker-fee cost of each turnover under the 2025 law, and deferred repairs.
The Matthews numbers describe occupancy today. They do not forecast income or returns.
If you want to compare a specific Boston two- or three-family against nearby rental supply, send me the address and the current leases and rents. I'll run the numbers and send you the analysis.
This article is general information, not legal or tax advice. Talk to your CPA and attorney about your own situation.